Network Visualization: Chinese Railway Transport from 1992 to 2011
2017-11-29
This is part of the preliminary data analysis of a course project. Data is collected from the National Statistical Beureau of China and in the unit of thousand tons. In the beginning, I start with a comprehensive table called data, where for each province there’s a matrix of 20 by 31, i.e. transport to each province w.r.t. different years. Therefore, it’s convenient to extract the actual transient matrix for each year by using the method groupby of Pandas.
Import Packages
The most important one is networkx in this project.
import warnings
import matplotlib
import numpy as np
import pandas as pd
import networkx as nx
import matplotlib.pyplot as plt
import matplotlib.patches as mpatches
from matplotlib.collections import LineCollection
from matplotlib.colors import colorConverter, Colormap

warnings.filterwarnings('ignore')

plt.rcdefaults()
plt.rcParams['font.family'] = 'serif'
plt.style.use('seaborn-paper')
plt.rcParams['axes.facecolor']='w'
plt.rcParams['axes.grid'] = False
plt.rcParams['figure.figsize'] = [10, 5]
Plotting Functions
There’re two functions, draw_networkx_edges_with_arrows for directed edges drawing, plot_network for whole networks drawing.
def draw_networkx_edges_with_arrows(G, pos, width, edge_color, alpha=0.5, ax=None):
ec = colorConverter.to_rgba(edge_color, alpha)
if ax is None: ax = plt.gca()
edge_pos = np.asarray([(pos[e[0]], pos[e[1]]) for e in G.edges()])
edge_collection = LineCollection(edge_pos, colors=ec, linewidths=width, antialiaseds=(1,),
linestyle='solid', transOffset = ax.transData)
edge_collection.set_zorder(1)
ax.add_collection(edge_collection)
if cb.is_numlike(alpha): edge_collection.set_alpha(alpha)
arrow_collection = None
arrow_colors = ec
p = .8 # length of edge apart from the arrow part
for (src, dst), lwi in zip(edge_pos, width):
x1, y1 = src
x2, y2 = dst
dx = x2-x1 # x offset
dy = y2-y1 # y offset
d = np.sqrt(float(dx**2 + dy**2)) # length of edge
if d == 0: continue
if dx == 0: # vertical edge
xa = x2
ya = dy*p+y1
if dy == 0: # horizontal edge
ya = y2
xa = dx*p+x1
else:
theta = np.arctan2(dy, dx)
xa = p*d*np.cos(theta)+x1
ya = p*d*np.sin(theta)+y1
dx, dy = x2-xa, y2-ya
patch = mpatches.Arrow(xa, ya, dx, dy, width=lwi/55, alpha=lwi*alpha/5, color=ec, transform=ax.transData)
ax.add_patch(patch)
minx = np.amin(np.ravel(edge_pos[:, :, 0]))
maxx = np.amax(np.ravel(edge_pos[:, :, 0]))
miny = np.amin(np.ravel(edge_pos[:, :, 1]))
maxy = np.amax(np.ravel(edge_pos[:, :, 1]))
w = maxx-minx
h = maxy-miny
padx, pady = 0.05*w, 0.05*h
corners = (minx-padx, miny-pady), (maxx+padx, maxy+pady)
ax.update_datalim(corners)
ax.autoscale_view()
return edge_collection
def plot_network(net, year, save=False):
u = net.source
v = net.target
w = net.flow
G = nx.DiGraph()
for ui, vi, wi in zip(u, v, w): G.add_edges_from([(ui, vi)], weight=wi)
pos = nx.circular_layout(G)
edge_labels = dict([((u, v,), d['weight']) for u, v, d in G.edges(data=True)])
weights = [G[u][v]['weight'] for u, v in G.edges()]
weights = np.array(list(map(lambda x: (x - min(weights)) /
(max(weights) - min(weights)), weights))) # normalize
weights = weights*10
fig = plt.figure(figsize=(10,10))
plt.axis('off')
nx.draw_networkx_edge_labels(G, pos, edge_labels=edge_labels, font_family='serif', font_size=4,
font_color='grey', bbox={'alpha':.0, 'lw':0})
nx.draw_networkx_nodes(G, pos, nodelist=G.nodes(), node_color='r', node_size=100)
draw_networkx_edges_with_arrows(G, pos, width=weights, edge_color='#5cce40')
nx.draw_networkx_labels(G, pos, font_color='white', font_family='serif', font_size=6)
fig.set_facecolor('#262626')
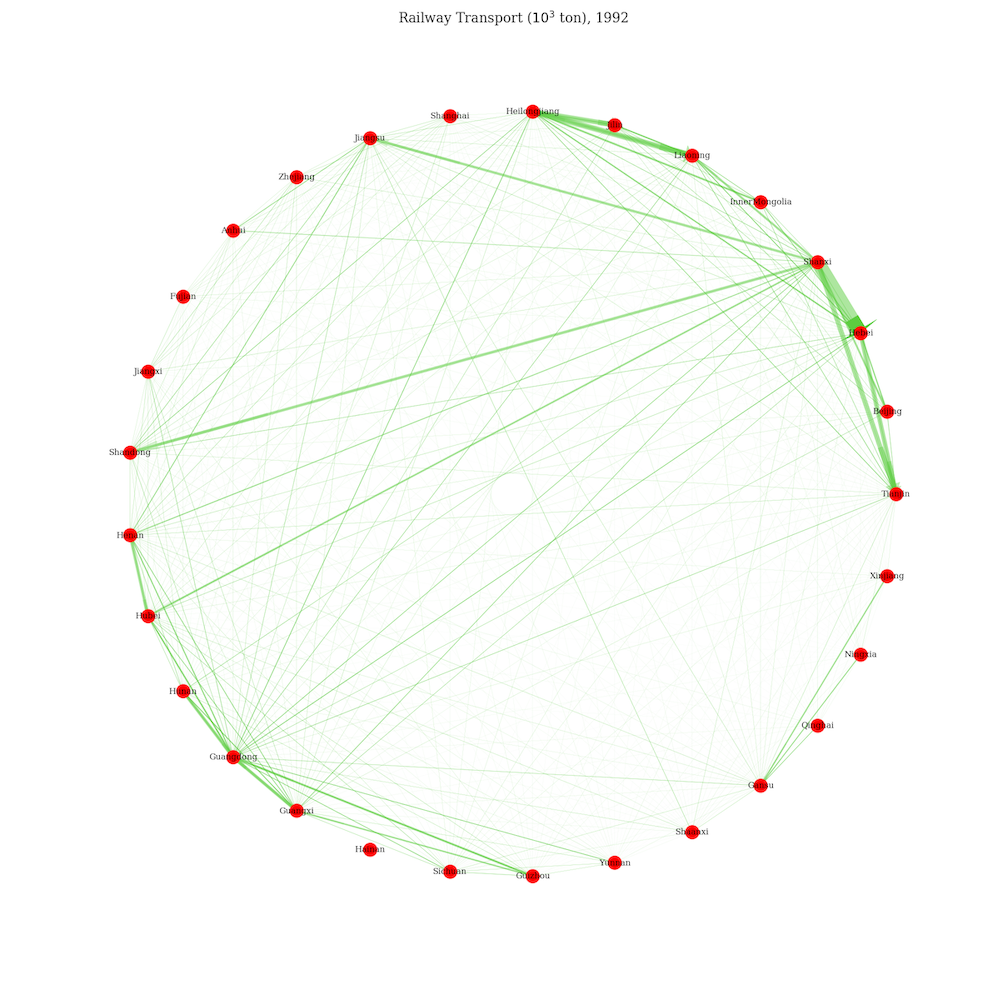
plt.title(r'Railway Transport ($10^3$ ton), {}'.format(year), color='white')
plt.tight_layout()
if save: plt.savefig('./plots/net{}.png'.format(year), facecolor=fig.get_facecolor())
plt.show()
Data Preparation and Plotting
As I mentioned in the beginning, here the transient matrices are extracted by groupby. For further usage, we save then by specifying the parameter save in plot_network to be True.
rail = data.ix[:,6:-1].fillna(0).astype(int).groupby(data.Year)
province = data.Province.unique()

for temp in list(rail):
    year = temp[0]
    net = temp[1]
    net.index = province
    net = pd.concat([net.ix[:,i] for i in net.columns], axis=0)
    net = pd.concat([pd.Series(net.index), pd.Series(np.repeat(province, 31)), pd.Series(net.values)],
                    axis=1, ignore_index=True)
    net.columns = ['source', 'target', 'flow']
    mask = net.source == net.target
    net = net[~mask]

    plot_network(net, year, True)
GIF Generation
Key package here is imageio. I’ve set the limit for maximum pixel to 1e10 in case there’s any overflow due to large figures in the above steps.
import imageio
from PIL import Image
Image.MAX_IMAGE_PIXELS = 1e10

image_list = [f'net{i}.png' for i in range(1992, 2012)]
gif_name = 'net.gif'
frames = [imageio.imread(image_name) for image_name in image_list]
imageio.mimsave(gif_name, frames, 'GIF', duration=.5)
Well, I have to say it looks gorgeous.